random
Random Design of Microfluidics
This site provides supplementary material to accompany the paper “Random Design of Microfluidics” by Junchao Wang, Philip Brisk, and William H. Grover, Lab on a Chip 16, 4212-4219 (2016) (PDF).
The file random.csv contains a table summarizing the results from all 10513 random microfluidic chip designs that were generated and simulated in the above paper. This is a text file in CSV (comma-separated values) format. Each line or row in the file corresponds to one random microfluidic chip design, and commas are used to separate the columns in the file.
The first 112 columns on each row contain a 1 if a particular channel is present in that row’s chip design or a 0 if that channel is absent in the design. The order of the columns corresponds to the purple channel numbers in this figure from the above paper:
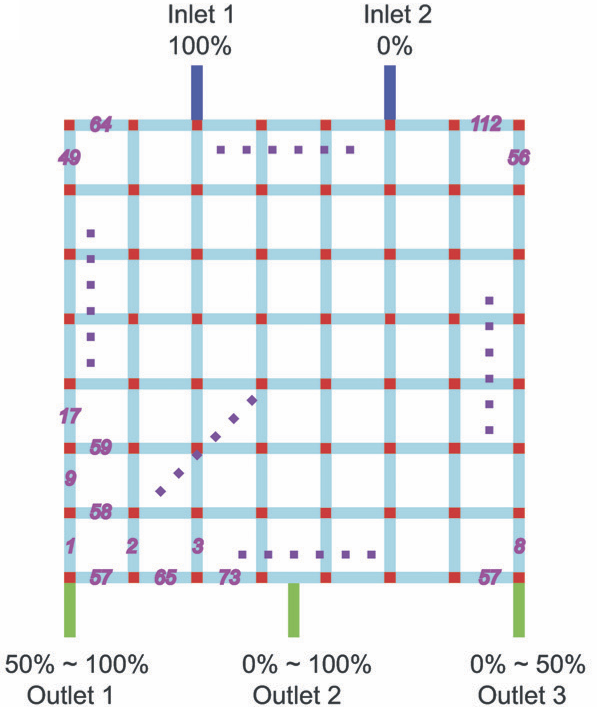
So for example, column 1 in the file contains a 1 if Channel 1 is present in that row’s design and 0 if Channel 1 is absent, column 2 contains a 1 if Channel 2 is present in that row’s design and 0 if Channel 2 is absent, and so on, all the way to column 112 (Channel 112).
The remaining six columns on each row summarize the simulation results for that row’s design.
Columns 113, 114, and 115 are the predicted flow rates at Outlet 1, Outlet 2, and Outlet 3, respectively. The units are meters per second.
Columns 116, 117, and 118 are the predicted solute concentrations at Outlet 1, Outlet 2, and Outlet 3, respectively. The units are a decimal representation of a percent concentration, so the values range from 0 (a 0% concentration of solute, which is also the same as the concentration of the fluid flowing into Inlet 2) to 1 (a 100% concentration of solute, which is also the same as the concentration of the fluid flowing into Inlet 1).
If you use this data in other research projects, we’d appreciate it if you cite the paper above. Thank you!